

Google Analytics offers an incredible amount of insight into your website’s visitor activity. Being a free tool, it’s not as robust or in-depth as some of the paid tools like Omniture or WebTrends. However, for most webmasters and marketing professionals who can’t reasonably afford the higher end solutions, Google Analytics will give you plenty of information upon which to make educated business decisions.
Google Analytics eCommerce Reports
Many people who use Google Analytics don’t fully utilize all the functionality within it. Perhaps it’s because they don’t understand the features – or even know they’re there.
We're sharing 7 ways you can up your game and utilize Google Analytics eCommerce reports to increase your site's conversion rate:
- Look at timelines using all time frames
- Utilize advanced segments
- Pay attention to mobile users
- Create intelligence events
- Set up event tracking
- Create & use custom reports
- Determine from where and why people are coming to your site
1. Look At Timelines Using All Time Frames
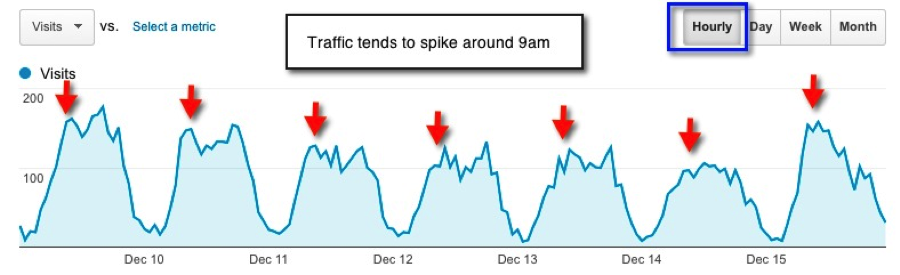
Consider all time frames (hourly, day, week, month. etc.) when looking for trends. Do your users tend to visit during or after work hours? Do you have higher conversion rates on weekends? Is your email marketing strategy more successful on certain days of the week?
Use Google Analytics eCommerce reports to plan out your efforts when there is quantifiable data. In this example below, traffic tends to spike around 9am - this could be useful in choosing when to launch a campaign, perform site maintenance, etc. to maximize or minimize its impact on users.
2. Utilize Advanced Segments
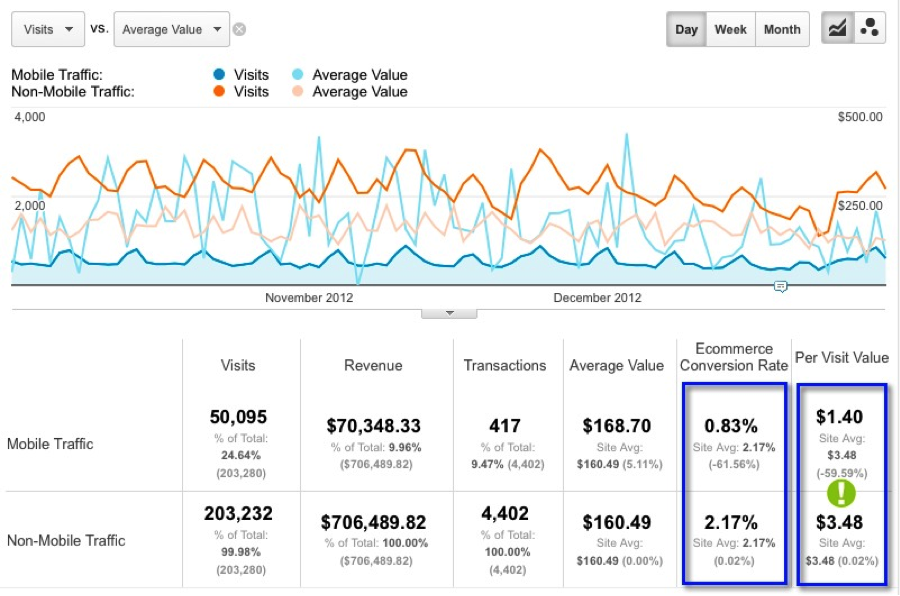
Utilize advanced segments to compare different groups of users or find a particular group within the standard set that Google provides.
In the following example, mobile traffic accounts for 20% of overall traffic but is 62% less effective in converting visitors when compared with non-mobile visitors.
Comparing Mobile vs. Non-Mobile Traffic:
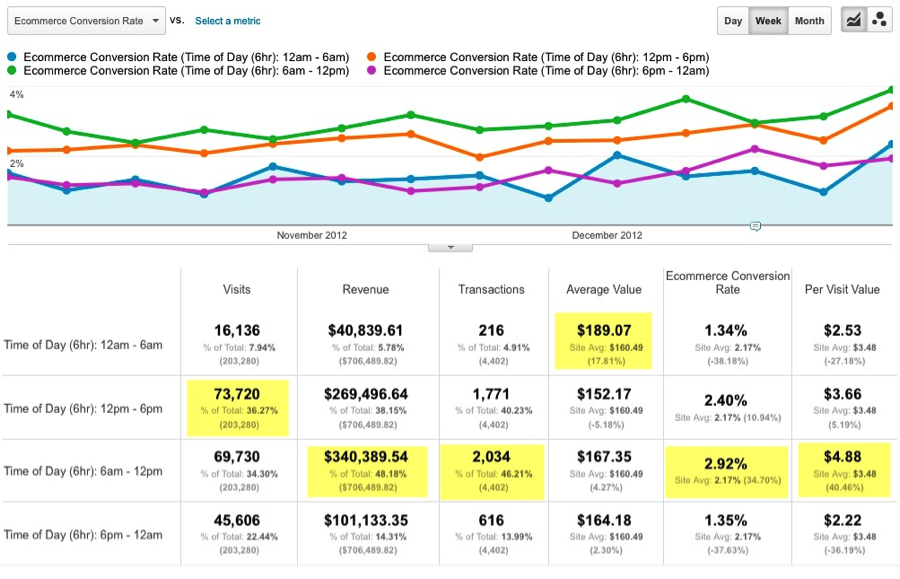
Comparing Success By Time Of Day:
Google allows you to apply up to four advanced segments at a time. It's easier to compare and contrast the different groups in Google Analytics eCommerce reports when the data is side-by-side.
In the second example, visitors who visit from 6am to noon convert more often and generate more revenue than any other time period.
3. Pay Attention To Mobile Users
Do you have a significant portion of visitors from mobile devices? If so, are they using smartphones or tablets? Do they spend much time on your site? Do they convert as well as non-mobile users? Do they abandon at a higher rate?
Something as simple as adding a mobile theme can, by itself, be helpful. Yet, proactively and regularly addressing problem areas can incrementally improve conversion rates over time.
4. Create Intelligence Events
Knowing when there are significant swings in traffic, conversion rates, revenue, etc. is helpful. Although Google builds automatic alerts, we recommend creating custom alerts if there are particular metrics you'd like to track.
For example, if you want to be alerted when traffic from a particular Advanced Segment (see #2) drops by more than 25%, set up custom alerts sot hat you're alerted by email or text message.
5. Set Up Event Tracking
Ever wanted to know how many times your PDFs have been downloaded, or how many times the play button is clicked on a Flash video, or how many times people play a mobile game in a single session?
Event Tracking allows you to see all kinds of interesting moments that do not end up at a thank you or confirmation page with its own URL.
For example, if you know that people who download a white paper are three times more likely to convert, you can adjust your promotions and more prominently feature your white papers on your site.
6. Create & Use Custom Reports
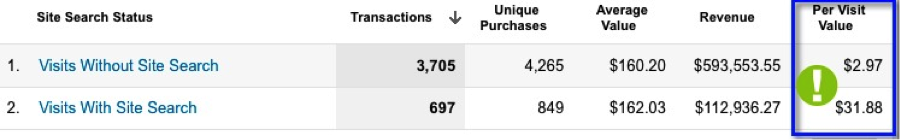
Jumping back and forth between several reports to see data that you might think would be visible within a single report (but isn't) is frustrating. That's why we recommend custom Google Analytics eCommerce reports.
In the example below, there is a clear correlation between users who utilize site search functionality – with a per visit value 973% higher than those who don’t.
This data could lead to increasing the visibility of site search on your website, but it may be missed without the insights gained by custom building reports.
7. Determine From Where and Why People Are Coming To Your Site
Referrals
Are you getting traffic from inbound links from other websites? Why or why not?
Spend some time in the Referrals section. You may be surprised at how much traffic you are getting from a few websites. Drill down into the pages that are linking to you to see what anchor text they’re using and to what page(s) they’re linking from their site. You never know what interesting insights you may uncover.
Search
If search drives a significant portion of your traffic, keyword reports are an invaluable source of data. People searching for early stage buying information like “best digital cameras" for example, want to see very different information than people searching for late stage buying information like “Nikon D3200 digital camera prices.”
If you find that most people are coming to your site on early stage keywords but are bouncing or otherwise leaving without converting, you may want to focus on providing additional resources or better optimizing targeted landing pages for those relevant keywords.
Campaigns
If you’ve been properly tagging your emails, paid search efforts, etc., they will show up here, giving you a quick place to compare all campaigns against each other.
Has the purchase discount link in your “thanks for signing up for our newsletter” confirmation email been successful? Has it driven more or less revenue than your paid search efforts? It’s easy to compare and contrast in this section.
Note: tag your email names descriptively (e.g. “12/17/12 Last Chance Christmas Free Shipping Email”) so you can quickly identify winners and losers in what may be an overwhelming list if you use a wide date range.
Conclusion
Every business owner or web manager must have the basic knowledge of how to view their own data in Google Analytics eCommerce reports. If you're still learning, that's okay. Take some time to explore these sections within Google Analytics, and you'll quickly notice trends and anomalies to help you make more educated business decisions.
If you have additional questions or would like to learn how Groove can help your business improve conversion rates, contact us through the form below. Our team will be in touch!

20 Best Shopify Apps For Your eCommerce Store
