In my last blog post “3 Things You May Not Have Known about Google AdWords," I briefly mentioned using Microsoft Excel to create a pivot table in order to find a good starting point for improving Quality Score. A lot of people reached out to me with questions so I decided it would make a great follow up blog.
Pay per Click (PPC) advertising can be time consuming, especially if you are managing multiple accounts. My goal is to help you optimize your accounts efficiently and effectively using available tools.
Using a Pivot Table to Look at Average Quality Score
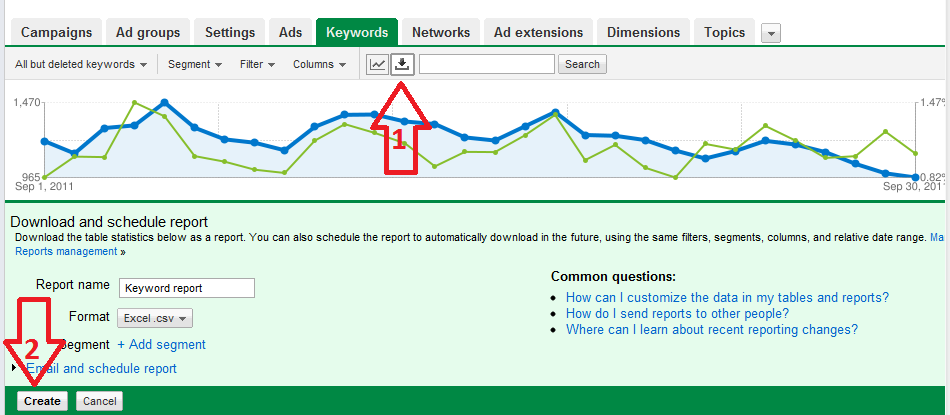
- Start by exporting a keyword report to Excel. The only columns you need are keyword, ad group, cost, quality score and impressions.
- Select the entire sheet and click pivot table on the insert tab. The pivot table will open in a new sheet.
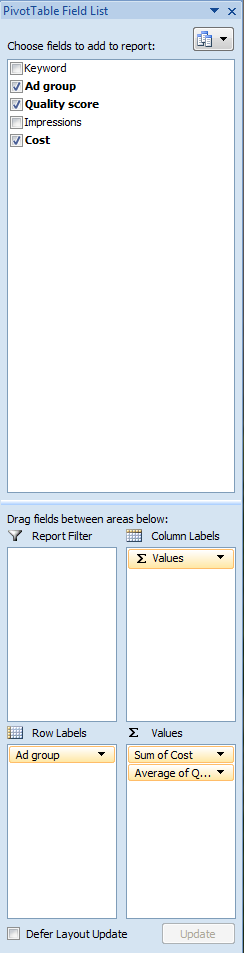
- Select the ad group, quality score and cost as fields to be included in your pivot table. Drag Cost and Quality Score to the box directly to the right (? Values). Click on cost, click on value field settings, select sum and then click OK. Click on Quality Score, click on value field settings, select average and then click OK.


This is a simple way of using a pivot table to look at Quality Score. The problem with this method is that it assumes that your quality scores are similar by cost and impression information across your ad group. For example, you may have an ad group with ten total keywords. Nine of those ten keywords have a quality score of 9 and one keyword has a quality score of 3. This pivot table would show an average quality score of 8.4. Now imagine the keyword with a quality score of 3 received 80% of the ad group’s clicks and impressions, this would represent an overlooked opportunity to improve your AdWords account’s performance.
You can combat this by using the simple formula below to generate a normalized quality score on an impression basis.
Creating a Pivot Table to Look at Normalized Quality Score
- Go back to the original spreadsheet. Create a new column and call it “Quality Score * Impressions”. Now multiple quality score and impressions and drag it down for the entire sheet. Refresh the data for your pivot table.
- Select Quality Score * Impressions as a field to be included in your pivot table. Drag Quality Score * Impressions to the box directly to the right (? Values) if it isn’t already there. Click on Quality Score * Impressions, click on value field settings, select sum and then click OK.
- Select Impressions as a field to be included in your pivot table. Drag Impressions to the box directly to the right (? Values) if it isn’t already there. Click on Impressions, click on value field settings, select sum and then click OK.
- Now you want to divide these two columns. The easiest way to do this is to highlight the two columns, copy them and then paste them in the two columns to the right. Create a new column and name it “Real Quality Score”. Now divide Sum of Quality Score * Impressions by Sum of Impressions and drag it down for the entire sheet. You now have a more accurate representation of Quality Score.
- Highlight columns D, E, F & G, right click and select Hide.
You should now be able see the Average of Quality Score and Real Quality Score columns side by side. Do you see any major discrepancies between Real Quality Score and Average of Quality Score? A good starting point is for optimizing your pay per click account is ad groups with high spend and low Real Quality Score.